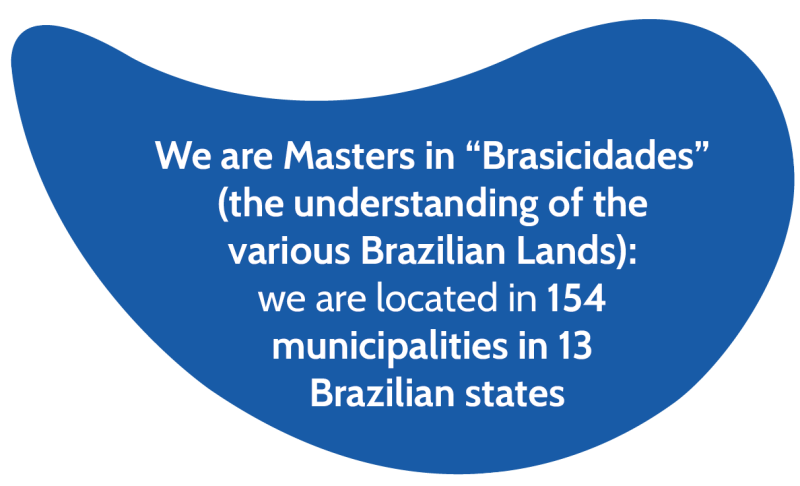


Swipe over the map to get more information about our units in each of the 13 Brazilian states


We transform the cities where we operate through quality sanitation, providing health benefits and dignity to the population, protecting and restoring water sources and leaving an essential legacy of development for future generations
• As Engineers of the Order Maintenance, we know how to operate and manage contracts and relationships with our stakeholders from the North to the South of the country
• We use the Aegea Operating Model, an important element ensuring that new assets are integrated with excellence and efficiency, while accelerating the creation of shared value
• In this regard, to ensure our team – the Professionals Who Go Above and Beyond Engagement – is engaged, we incorporate elements into our corporate culture that reflect our belief that we are leaders in efforts to reverse the sanitation deficit in Brazil
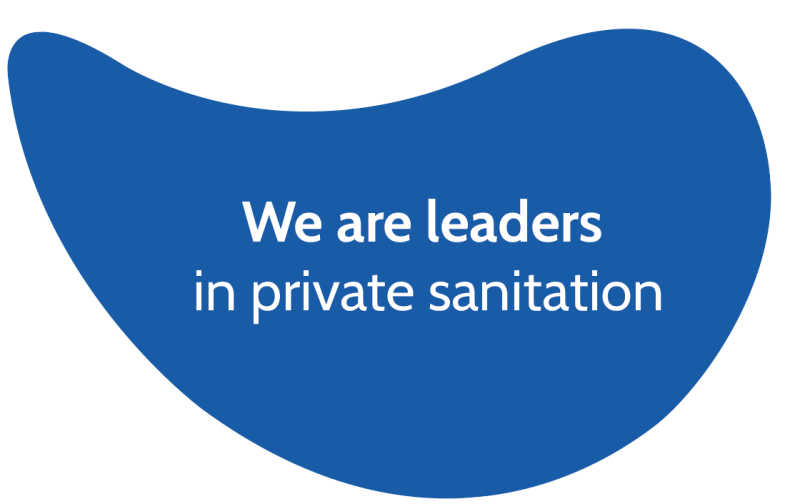
share of the
private market
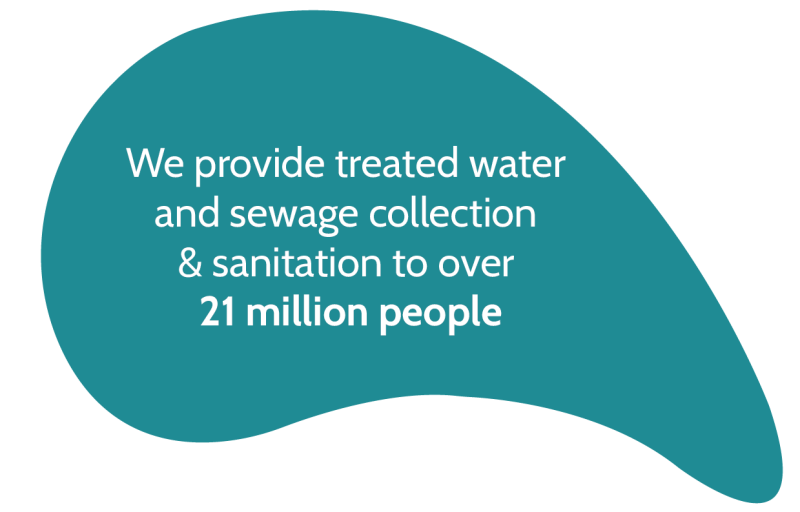
people supported
We had the winning bid in 2021
for one of the largest auctions in
the sector – blocks 1 and 4, regarding
water and sewage services concession
in the State of Rio de Janeiro
(Cedae auction) – which nearly
doubled our size


a growth of 27.1% compared to 2020
an increase of 44.6% compared to 2020
it was 21.2 million in December 2021 and increased to 21.4 million with the new concession in Crato, State of Ceará, in February 2022
48.5% higher than in 2020
an increase of 49.2% compared to 2020
a 7.5 percentage points hike compared to 2020


 Learn more